Mississippi River Morganza Spillway satellite image

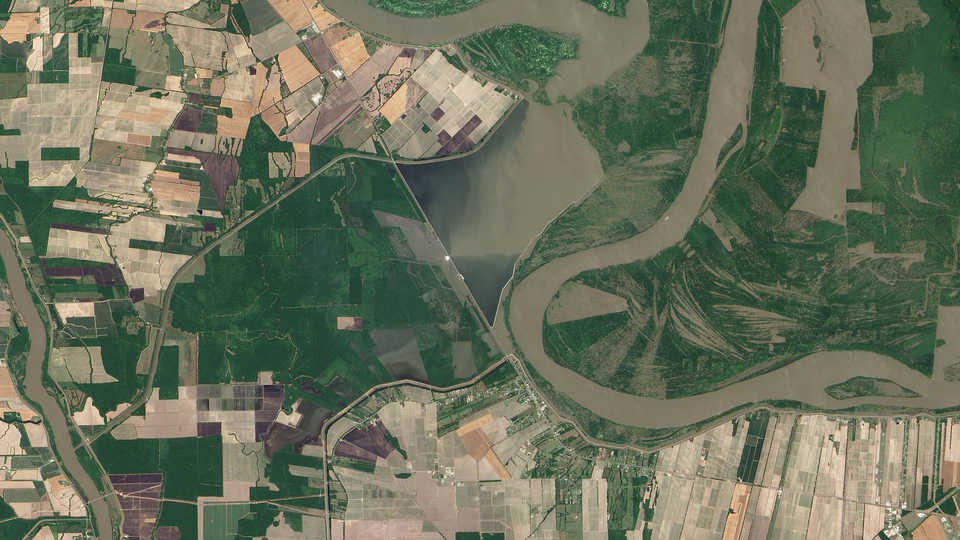
"Morganza Spillway" © 2011 NASA Earth Observatory

0

Can we use a model to predict the impacts of nutrient pollutants on an aquatic ecosystem? In this activity, students participate in a kinesthetic simulation to illustrate how nutrient pollution from agricultural runoff can lead to a dead zone at the mouth of a drainage basin.

Essential Question

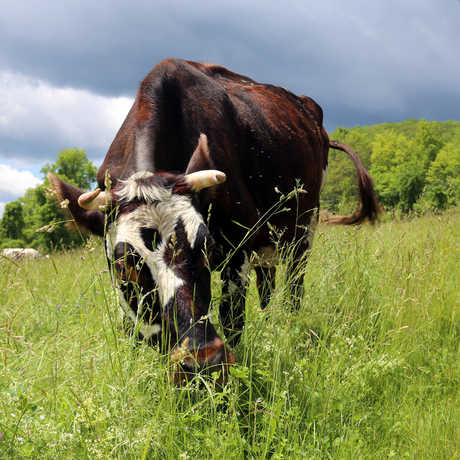
How does agriculture affect aquatic ecosystems?

Objectives

Students will

  1. Describe how scientists use models to represent systems and their interactions—such as inputs, processes, and outputs—and energy, matter, and information flow within systems.
  2. Recognize and describe the limitations of representing larger complex systems with models.
  3. Illustrate how increased nutrient concentrations in rivers and streams from agricultural runoff can lead to algal blooms and dead zones at the mouths of drainage basins.
Materials
Agriculture data set
Scientific Terms for Students
  • algal bloom: rapid increase of algae in a body of water
  • decomposer: an organism that breaks down wastes and dead organisms
  • drainage basin: an area drained by a river system, including all areas that gather precipitation water and direct it to a particular stream, lake, or other body of standing water
  • eutrophication: an increase in the concentration of inorganic nutrients (like phosphorous and nitrogen) in a body of water that occurs either naturally or as a result of runoff from human activities like agriculture
  • nutrient: a substance that provides nourishment for growth or metabolism
  • phytoplankton: plant-like plankton, primarily microscopic algae and protozoa, that carry out photosynthesis
Educator Prep: Part I
  1. Print out one Mississippi River drainage basin map per group.
  1. Test the video quality on your school’s internet connection. Note that you can click the Settings cog in the footer to adjust the Quality to up to 1080HD, and you can also toggle on Full Screen.
Part I: Introduction (60 minutes)
  1. Show students the 30-second How Did Human Civilization Spread? (North America) visualization clip, and ask them to describe what they notice. You might need to play the clip through a couple of times, or scrub the clip backwards to highlight how agriculture follows stream systems in pre-Columbus times.
    • What patterns do you see in this clip?
    • How does agriculture in North America change through time? What if we move backwards in time?
    • What sorts of factors control or influence where agriculture can occur?
       
  2. Open your web browser to CropScape.  Zoom into the Mississippi River drainage basin area and project this for students to see. Make sure you are looking at the most recent year of data and have the Water Layers toggled on. For easier viewing, it is also recommended that the County Boundary Layer is toggled off.
     
  3. Hand out the map of the Mississippi River drainage basin and explain the concept of a drainage basin to students. The Mississippi River drainage basin is the largest drainage basin in North America.
     
  4. Ask students to make some observations about where crops are grown within the Mississippi River drainage basin. Give them several minutes to analyze and discuss with their peers, then discuss as a class.
    • Do you notice any correlations between the drainage basin map and the location of farmland? (Farms are often located along rivers or river systems.)
    • Who can describe where water from central North Dakota flows and where it eventually ends up?
    • Knowing that the Mississippi River drainage basin in full of farmland, what types of materials might end up in the stream system? In other words, is water the only thing that a drainage basin drains?
    • Do you think farms have any impacts on the environment? Do farms produce any pollution? (Yes, pesticides and fertilizers that are put onto the farm fields can have an impact on the environment.)
    • Can this pollution get into rivers and streams? (Yes, when it rains.)
    • Do you think this might affect the plants and animals that live in the streams or where the streams flow to? Turn to a partner and share some ideas for one positive impact this runoff might have on living organisms, and one negative impact.
       
  5. Plants, like people, need nutrients to grow. Farmers often put fertilizers rich in nutrients like nitrogen and phosphorous on their fields. When it rains, these nutrients can be washed into surrounding rivers and streams and impact the environment. Explain to students that you are going to be creating a model to look at how nutrients (‘inputs’) from farm fields that get washed into rivers and streams move through the Mississippi River drainage basin. Many of these nutrients are dissolved in the water, and thus are not directly observable to us, but we can model how they flow through a drainage basin with something that is observable.
     
  6. Go over the concept of eutrophication and how a dead zone forms in an aquatic ecosystem. You can have students draw and fill in a flow chart showing these processes while you talk about them (see Background for Educators).
    • What do you think might happen if there was a sudden spike in nutrients in an aquatic ecosystem? What happens in other ecosystems when there is suddenly a lot of food available to a certain species? (More individuals can survive, so the population grows.)
    • When organisms die, they are decomposed by things like bacteria. When organisms produce waste, this waste is also decomposed by bacteria. Can you describe the process of decomposition? What does this process need to occur? (Decomposition uses oxygen.)
    • If decomposition happens at a faster rate, what happens to the available oxygen in an environment? (It is depleted at a faster rate.)
    • What happens to organisms who need oxygen to survive if their environment suddenly becomes depleted in it? (They move or die.)

Tell the students that they are going to be a part of the model simulating eutrophication, and assign each student a role from the Model Role List, modifying them accordingly to accommodate your class size.

Educator Prep: Part II
  1. Use sidewalk chalk or tape to draw/lay out on a playground blacktop or classroom floor a large simplified model of the Mississippi River drainage basin as shown in the Model Set-Up. You will draw out the paths, or ‘tributaries,’ that the students will follow during the model demonstration. Label the junctions (tributary confluences) 1-7 as shown in the Model Set-Up.
Part II: Modeling Activity (60 minutes)

Pass out clipboards to the water quality monitoring station(s) and instruct students to go to their assigned locations (tributaries, stations, organisms).

  1. The teacher will be the ‘source’ of the nutrients (farms) in the first model run. Note: After the first run through the model, the role of the nutrient source can be passed to a student. The nutrients are in units of ‘packets,’ with each packet representing some arbitrary concentration of nitrogen and phosphorous that could wash into a stream from one farm.
    • How do nutrients in fertilizers that are put onto farm fields get into rivers or streams? (rainfall and runoff)
       
  2. Explain to students that you are going to track nutrients that enter the drainage basin in the smaller tributaries far from the basin mouth to the mouth itself. Review upstream and downstream if needed.
     
  3. For the first model run, you will start out with the same amount of nutrient pollution in each tributary. Pass out 3 nutrient packets to each of the tributaries, including the main river trunk (i.e., the student who starts at junction 6). The water quality monitoring station(s) should record the starting number of nutrient packets in each tributary on the datasheet(s). (Note that for all subsequent model runs, refer to the Variable Cards for how to modify the starting conditions).
     
  4. When the teacher says ‘go,’ the smallest tributaries move their nutrients slowly downstream until their tributary ‘ends’ (at a junction), where they pass their nutrients on to the larger tributary they flow into. When they pass on their nutrients, they should give their larger tributary a high five and freeze, giving the water quality monitoring station(s) time to count the nutrients at the junction and record this information on the datasheet(s). This process continues downstream until all nutrients have reached the drainage basin mouth.
     
  5. When the nutrients have made their way to the mouth of the drainage basin, stop the simulation and ask the water quality monitoring station(s) to share the data with the class.
    • How does the number of nutrient ‘packets’ at the mouth of the basin compare to the concentrations that started at each of the small tributaries? (the concentration at the mouth is bigger/the concentration at the mouth is a sum total of what started in tributaries)
    • This model is a simplification of the real drainage basin system. Do you think all of the nutrients that enter the system upstream actually end up at the drainage basin mouth? Why or why not? (Organisms living in the water upstream might use some of the nutrients before they reach the basin mouth)
       
  6. Ask students to recall what happens in aquatic ecosystems when there is a large influx of nutrients (eutrophication) --> algal bloom! What happens when the algae die and sink to the bottom OR are eaten and become waste that sinks to the bottom? They are decomposed, which uses oxygen that is already present in the water. In order to determine how much oxygen will be removed from the water by decomposition in your model, the level of algal growth must first be assessed. Students should use the Algal Growth Scale on their Student Worksheets to verbally classify the level of algal growth at the basin mouth and to determine what concentration of oxygen remaining in the water this corresponds to. The water quality monitoring station(s) will record this on the datasheets.
     
  7. Ask students to look at the Aquatic Organism Information Table on their Student Worksheets and identify who can survive with the amount of oxygen remaining in the water. The water quality monitor(s) should circle these organisms on the datasheets next to the appropriate model run. Students who are playing the roles of organisms who cannot survive in the established oxygen levels can try to escape their environment if they are mobile (like fish) or will have to perish (dramatic actions encouraged).
     
  8. Variable Cards: Repeat the model by having a student choose a Variable Card and initiating the change in the system stated on the variable card. For these additional model runs, the students should be given more autonomy in figuring out how the changes outlined on the card should affect the system. The water quality monitoring station(s) should continue to record the data for each model run.

Return to the classroom with at least 20 minutes remaining in the class period to wrap up the lesson.

Wrap-Up
  1. Display the water quality datasheet(s) (e.g., using a document camera) in the classroom for the students to see.
    • How did the Variable Cards influence the results of the simulation? Explain the data we collected.
       
  2. Ask students to explain in their own words the process of eutrophication and how a dead zone forms.
    • How can human activities at locations upstream impact ecosystems many miles away?
       
  3. (Optional) Show students this 4-minute NOAA video clip on hypoxia and dead zones. Ask them to identify any new information about eutrophication and dead zones presented in the video. (Water of different densities prevents mixing of vertical water layers, so low-oxygen water gets trapped near the bottom until the water column can be mixed up again by wind in the fall. The dead zone can come and go and change in size.)
     
  4. Reflect on what parts of the model were a lot like the real Mississippi River system, and what parts weren’t (model limitations).
    • What were two things the model simulation showed quite effectively? (Examples: The big picture idea of how pollutants in a drainage basin can become concentrated at the basin mouth and how human activities can impact aquatic ecosystems near and far.)
    • What were some assumptions we made in this model? Were they good assumptions? (Example: All nutrients that entered the tributaries flowed to the drainage basin mouth and didn’t get used along the way.)
    • How could we improve this model to make it more realistic or accurate? (Examples: Change the units of nutrients from arbitrary ‘packets’ to a more realistic unit and base concentrations off of real runoff data; Start the model with nutrients distributed in the tributaries proportional to the amount of farmland surrounding each tributary.)
    • Why do scientists use models? (To better understand large, complex systems and to test how these systems will respond to changes.)
Assessment Ideas
  • Have students illustrate a static version of the model in their science notebooks. Their notebook entry should include: an explanation of what each part represents, a description of how scientists could use the model to make decisions about managing new farmland, two strengths of the model, and two limitations of the model.
    • Bonus points: using the class data from the water quality monitoring stations, draw a simple graph showing the increasing nutrient levels with distance downstream in the basin.
       
  • Use the Variable Cards that were not implemented during the modeling activity to test your students’ ability to use the model as a predictive tool. Have them write down what they think should happen in/to given the scenario outlined on the Card(s).
Extensions
  • Have students search for and evaluate news or scientific articles outlining the solutions that are being proposed to deal with the Gulf of Mexico dead zone.
     
  • Explore the phenomenon of Harmful Algal Blooms (HABs) in your classroom.
Background for Educators

Eutrophication is the process by which there is an increase in the availability of nutrients in an aquatic system that can result in increased algal growth. Eutrophication can occur both naturally or as a result of human activities such as agriculture that increases the level of nutrients in a body of water through fertilizer runoff. An excess of nutrients results in excessive algal growth, and bacterial decomposition of algae depletes oxygen available for other aquatic life. This can lead to very low or depleted dissolved oxygen conditions—hypoxia and anoxia, respectively—in the water column such that many marine organisms cannot survive. This is known as a ‘dead zone’ (NOAA, retrieved August 2015).

Eutrophication of nutrients --> Accelerated algal growth --> Decomposition of dead algae uses up available oxygen --> Dead zone near floor

Coastal regions near the outlets of drainage basins that drain agricultural lands are particularly affected by eutrophication as nutrients that enter smaller tributaries upstream become concentrated at the basin mouth, creating widespread dead zones. The Mississippi-Atchafalaya River Basin, the largest drainage basin in North America, drains over 1.2 million square miles of land area characterized by heavy agricultural use into the Gulf of Mexico. Hypoxic conditions near the seafloor at the mouth of this drainage basin are intensified in the late spring and summer as winds decrease and the water column becomes strongly stratified. Scientific research indicates that hypoxic conditions in the Gulf of Mexico have increased since the 1950s as a result of increased human activities like farming within the Mississippi-Atchafalaya River Basin (Osterman et al., 2005). In 2013, the dead zone off the coast of Louisiana was the size of Connecticut (NOAA, 2013).

Eutrophication and hypoxia have a significant impact on the diversity of species and food webs within aquatic ecosystems. Studies in the Gulf of Mexico specifically have found that the number of aquatic species that typically live within the sediment on the seafloor--and thus cannot easily escape low oxygen conditions--declines in a dead zone (Harper Jr. et al., 1981). A reduction in the biodiversity of an ecosystem means a reduction in important ecosystem services that keep the ecosystem healthy. Dead zones also have important economic impacts, affecting the productivity of fisheries and the people who rely on them for their livelihood.

Solving the problem of dead zones caused by human activities is not trivial, but has generally focused on reducing the amount of nutrients entering drainage systems from croplands (Rabotyagov et al., 2014). Nutrient pollution that contributes to the formation of dead zones is referred to as ‘nonpoint source pollution’ because it is difficult to trace the pollutants from where they end up back to their exact source.

Next Generation Science Standards

Disciplinary Core Ideas (6-8)

  • MS-ESS3.C: Human Impacts on Earth Systems: Human activities have significantly altered the biosphere, sometimes damaging or destroying natural habitats and causing the extinction of other species. But changes to Earth’s environments can have different impacts (negative and positive) for different living things. (MS-ESS3-3)

Science and Engineering Practices (6-8)

  • Developing and Using Models: Develop and/or use a model to predict and/or describe phenomena.
  • Constructing Explanations: Construct an explanation using models or representations.

Cross-Cutting Concepts (6-8)

  • Systems and System Models:
    • Systems may interact with other systems; they may have sub-systems and be part of larger complex systems.
    • Models can be used to represent systems and their interactions—such as inputs, processes, and outputs—and energy, matter, and information flow within systems.
    • Models are limited in that they only represent certain aspects of the system under study.
  • Cause and Effect: Cause and effect relationships may be used to predict phenomena in natural or designed systems

Related Performance Expectations

Remember, performance expectations are not a set of instructional or assessment tasks. They are statements of what students should be able to do after instruction. This activity or unit is just one of many that could help prepare your students to perform the following hypothetical tasks that demonstrate their understanding:

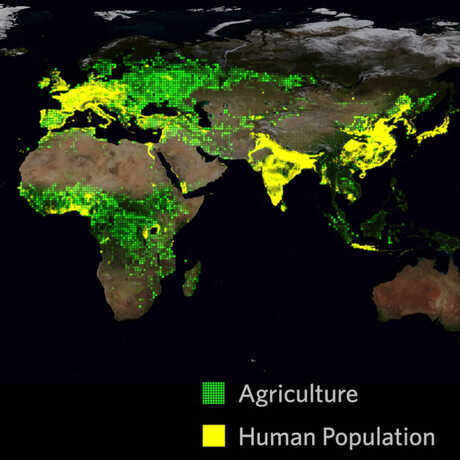
MS-ESS3-4: Construct an argument supported by evidence for how increases in human population and per-capita consumption of natural resources impact Earth's systems.


California Environmental Principles and Practices
  • Principle II: The long-term functioning and health of the terrestrial, freshwater, coastal and marine ecosystems are influenced by their relationships with human societies.
    • Concept a: Students need to know that direct and indirect changes to natural systems due to the growth of human populations and their consumption rates influence the geographic extent, composition, and biological diversity, and viability of natural systems.
    • Concept c: Students need to now that the expansion and operation of human communities influences the geographic extent, composition, biological diversity, and viability of natural systems.
Agriculture and Population Growth Data Sources

Goldewijk, K.K., Beusen, A., & Janssen, P. (2010). Long term dynamic modeling of global population and built-up area in a spatially explicit way, HYDE 3 .1. The Holocene (20.4), 565-573.

Goldewijk, K.K., Beusen, A., van Drecht, G. & de Vos, M. (2011). The HYDE 3.1 spatially explicit database of human-induced global land-use change over the past 12,000 years. Global Ecology and Biogeography (20.1), 73-86.

References

Harper Jr., D.E., McKinney, L.D., Salzer, R.R., & Case, R.J. (1981). The occurrence of hypoxic bottom water off the upper Texas coast and its effect on the benthic biota. Contribution in Marine Science, 24, 53-79.

Louisiana Universities Marine Consortium (LUMCON) (n.d.). Hypoxia in the Northern Gulf of Mexico. Retrieved July 2015 from http://www.gulfhypoxia.net/overview/

NOAA (n.d.). Hypoxia. Retrieved August 2015 from http://oceanservice.noaa.gov/hazards/hypoxia/

Osterman, L.E., Poore, R.Z., Swarzenski, P.W., & Turner, R.E. (2005). Reconstructing a 180 yr record of natural and anthropogenic induced low-oxygen conditions from Louisiana continental shelf sediments. Geology, 33, 329-332.

Rabotyagov, S.S., Campbell, T.D., White, M., Arnold, J.G., Atwood, J., Norfleet, M.L., Kling, C.L., Gassman, P.W., Valcu, A., Richardson, J., Turner, R.E., and Rabalais, N.N. (2014). Cost-effective targeting of conservation investments to reduce the northern Gulf of Mexico hypoxic zone. PNAS 111.52, 18530-18535.

United States Geological Survey (2014) Eutrophication Definitions. Retrieved July 2015 from http://toxics.usgs.gov/definitions/eutrophication.html

Image: Morganza Spillway, NASA Earth Observatory image by Jesse Allen and Robert Simmon, using EO-1 ALI data; originally sourced from https://earthobservatory.nasa.gov/images/50623/morganza-spillway-opens-in-louisiana. Image is freely available for re-publication or re-use, including commercial purposes. NASA requests that NASA’s Earth Observatory be given credit for its original materials; the only mandatory credit is NASA. Credit given to this image is: NASA Earth Observatory image by Jesse Allen and Robert Simmon, using EO-1 ALI data.
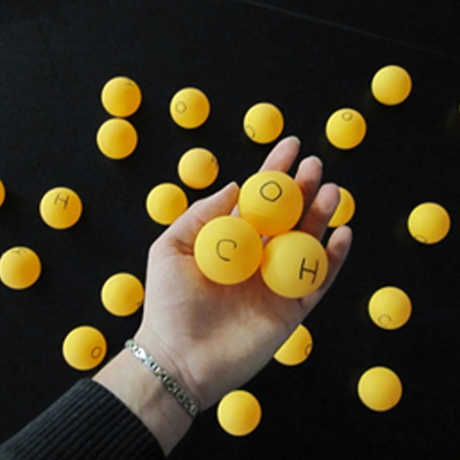
Appropriate for: 6th Grade - 11th Grade
Standards for: 6th Grade, 7th Grade, 8th Grade
Prep Time: 15 minutes
Activity Time: 120 minutes
Subjects: Developing & Using Models, Systems & System Models