Science News
Holiday Lights from Space

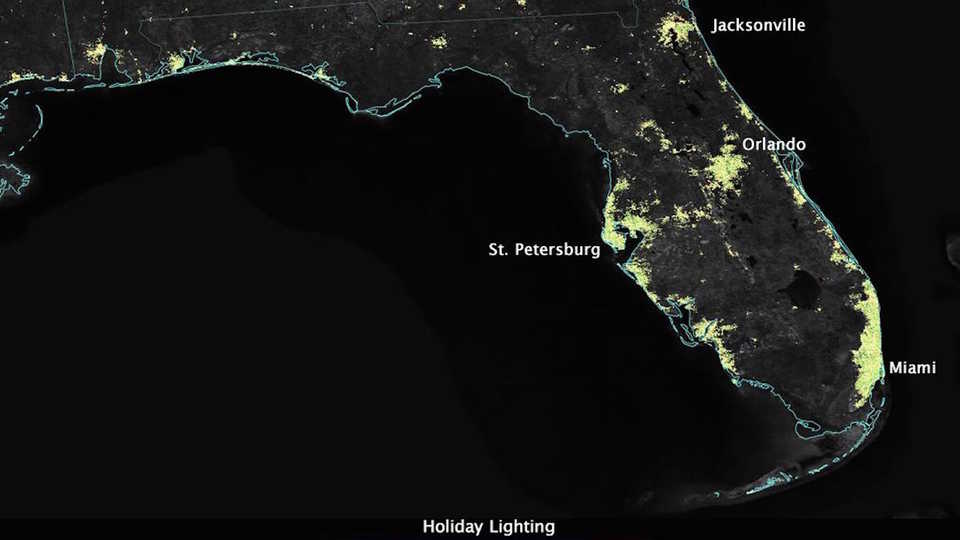
How does holiday illumination look from space? Scientists are using data from the NASA Suomi-NPP satellite to tease out those images, available in the slideshow above, or on Flickr.
“Holidays signal a ton of human activity,” Miguel Roman of NASA Goddard explained last week at the American Geophysical Union (AGU) meeting in San Francisco. So he and his colleagues took the three years of data from Suomi-NPP to see how that activity can be viewed from space. They created cloud-free, and atmospheric-, terrain-, lunar-, fire-, snow-, and straylight-corrected imagery that displays certain holidays in a whole new light.
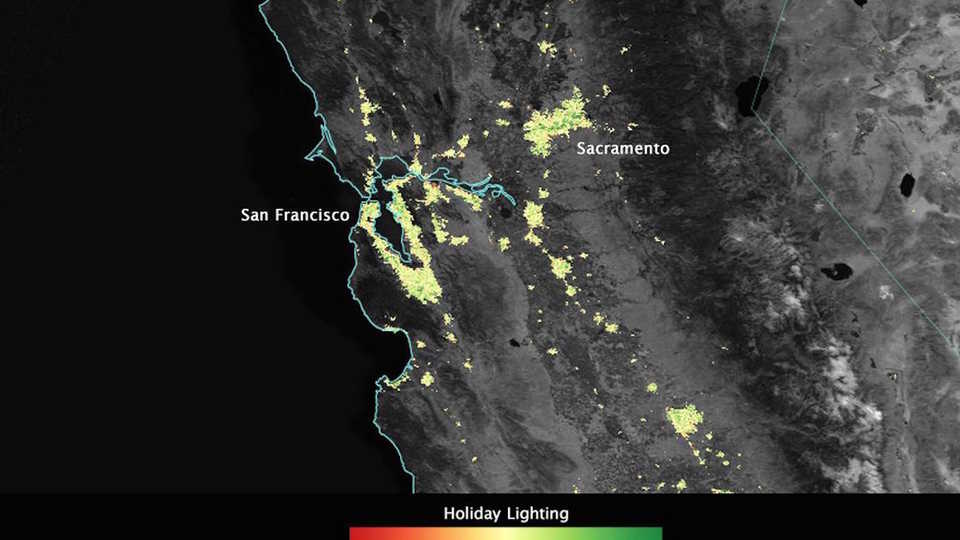
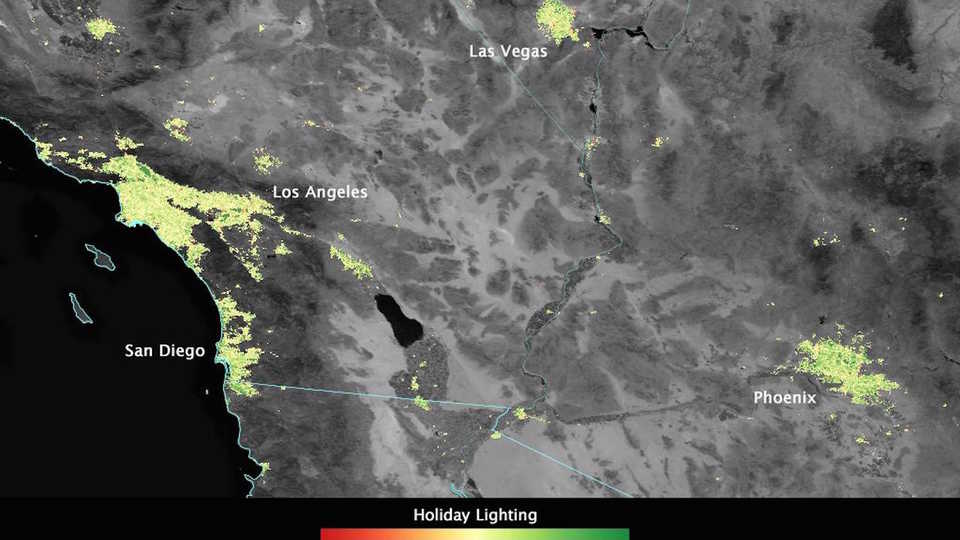
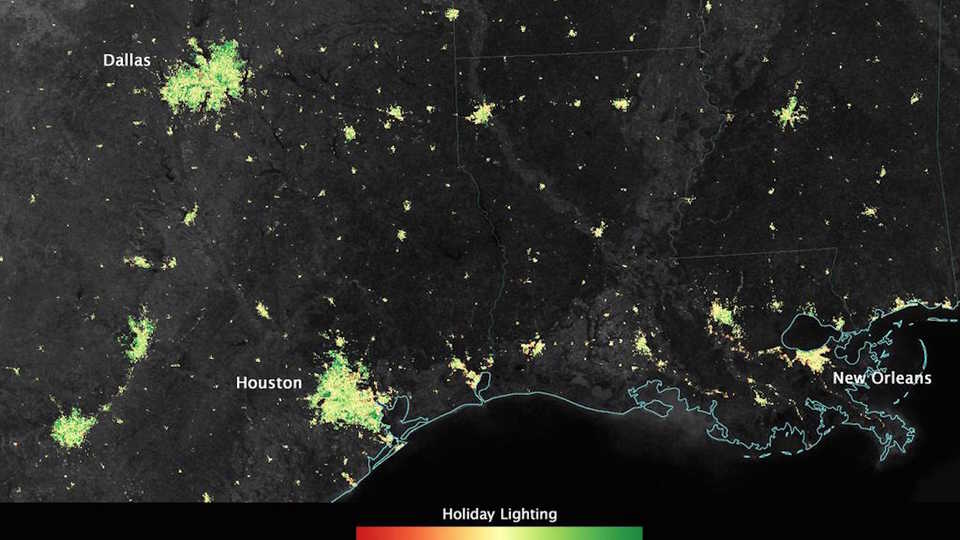
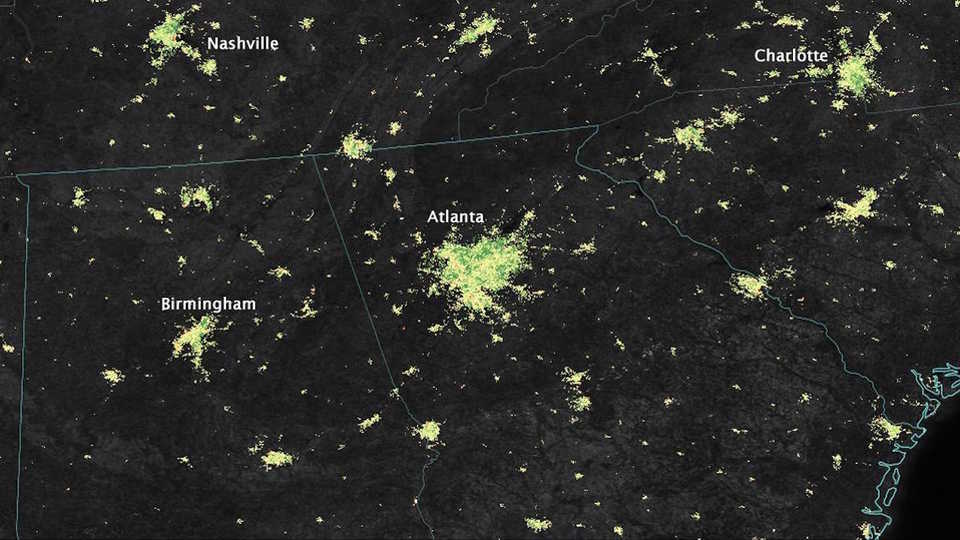
In the U.S., from Thanksgiving to the first week of January, the lights in urban areas change to reveal increased output in predominantly residential areas—a shift from cities to suburban and exurban areas. (The green in the pictures above illustrates this holiday surge.) Why might you expect this to be so?
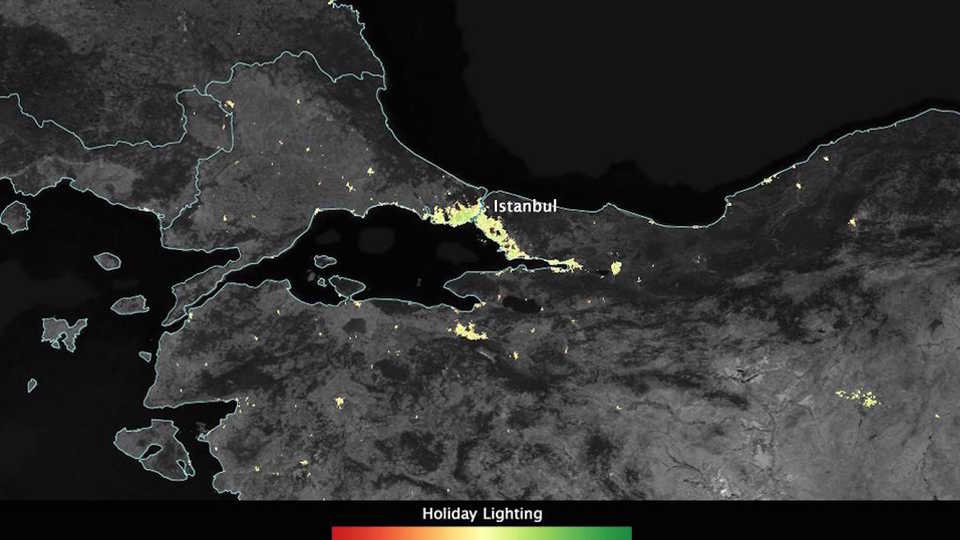
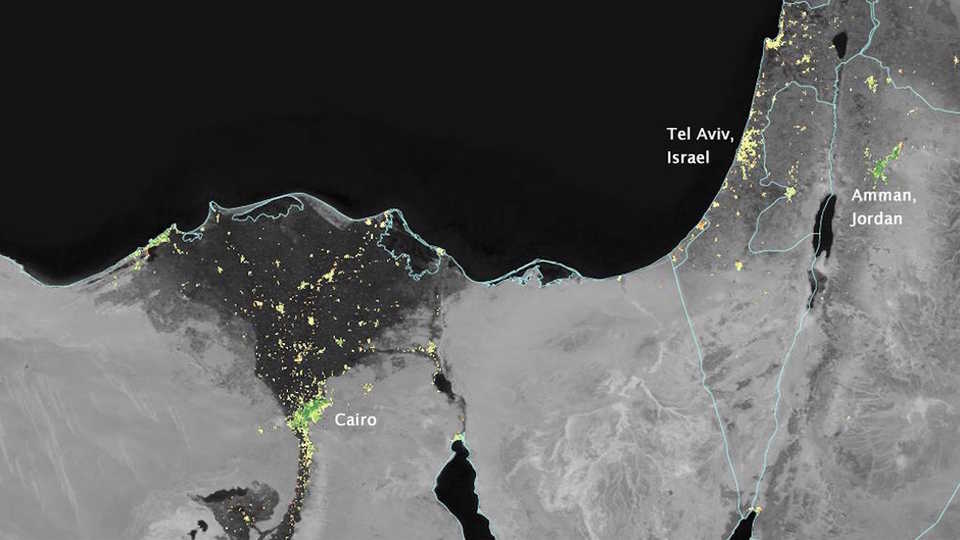
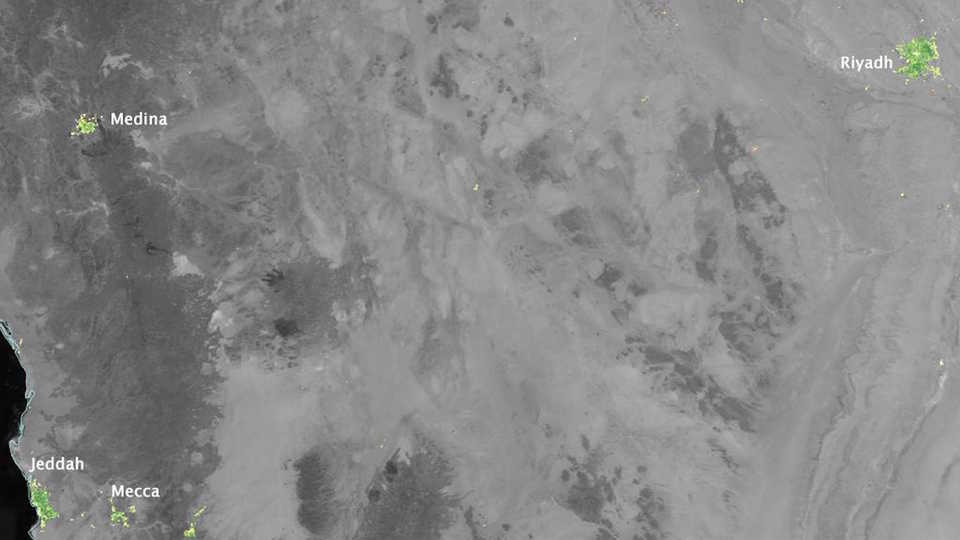
In the Middle East, the team instead tracked lights during the Ramadan holiday, where Muslims fast from dawn until dusk for thirty days. Activity—and lighting—increases at night, as families stay up late for feasting, participating in nighttime prayers, and getting some welcome relief from high daytime temperatures. But unlike the U.S., the increased use of light occurs within urban areas.
These findings are about more than just lights and pretty pictures. Roman said that these patterns can help guide climate mitigation solutions in the future—so much of energy service demand results from human activity in a social and cultural context. This context can help find solutions for one region, and different solutions for another.
In the meantime, enjoy this season of light!