Science News
Universe Update - February 2014
February 26, 2014
by Ryan Wyatt
The third Thursday of every month, the Morrison Planetarium hosts “Universe Update” at the 6:30 planetarium show during NightLife. I select my favorite astronomy stories from the past month, and I give a brief run-down of current discoveries while taking audiences on a guided tour of the Universe. As you may or may not know, the planetarium sports a three-dimensional atlas of the Universe, so we can take you places virtually while talking about the latest astronomy news.
I always start at Earth and work my way out to cosmological distances, so I’ll list the news stories in the same order—from closest to farthest from home.
Two press releases, one from MIT and another from Harvard, describe a detailed survey of some 100,000 asteroids—those potato-shaped relics from the early solar system that orbit (mostly) between the orbits of Mars and Jupiter. The Sloan Digital Sky Survey (SDSS) caught more than 100,000 of these objects in its sights, and researchers studied the size, location, motion, and composition of each one. In the process of cataloging the differences, they found that the expected trend—rocky asteroids close to the light and heat of the Sun, icier bodies farther away—didn’t quite fit the data. The larger asteroids followed such a trend, but the smaller objects were scattered more widely.
Why might that be? Francesca DeMeo, at the Harvard-Smithsonian Center for Astrophysics, put it succinctly: “We found that the giant planets shook up the asteroids like flakes in a snow globe.” This suggests that the planets’ orbits have changed over time—indeed, Jupiter may once have wandered as close to the Sun as Mars! Thus, the gravitational influence of the Solar System’s larger objects seems to have scrambled the asteroids’ orbits, creating the distribution we see today. Mixing metaphors a bit, DeMeo went on to say, “It’s like Jupiter bowled a strike through the asteroid belt… Everything that was there moves, so you have this melting pot of material coming from all over the Solar System.”
Coincidentally, UC Berkeley planetary astronomer (and visualization virtuoso) Alex Parker just released a video entitled Painted Stone: Asteroids in the Sloan Digital Sky Survey, which depicts those 100,000+ asteroids color-coded by their composition. In the video, you can easily see both the general trend of rocky to icy asteroids (seen as a transition in color from warm to cool hues) as well as the mixing caused by giant planets’ stirring up the asteroids’ orbits.
Zeroing in on one particular, particularly famous asteroid… Itokawa has received special attention from the European Southern Observatory’s New Technology Telescope (NTT), in the form of more than a decade’s worth of observations! Compared to the very basic (one could say superficial) assessment of asteroids’ composition performed by SDSS, the NTT data allows astronomers to figure out what’s going on inside Itokawa. Twelve years’ worth of NTT observations allowed for the accurate calculation of the asteroid’s rotation. It changes slightly over time (to the tune of 0.045 seconds per year), due to the Yakovsky-O’Keefe-Radzievskii-Paddack effect: basically, as it gets heated by the Sun, it radiates energy in a way that speeds up its rotation, which in turn gives clues to its shape and internal structure. (Our knowledge of Itokawa benefitted tremendously from a visit by JAXA’s Hayabusa mission in 2005, when the spacecraft orbited the asteroid and eventually landed on its surface before returning to Earth. So we happen to know the asteroid’s shape very, very well.) The NTT observations suggest that Itokawa’s peanut shape incorporates two regions of very different densities: the asteroid we know and love may have formed from two components of a double asteroid that collided and merged.
“This is the first time we have ever been able to determine what it is like inside an asteroid,” says Stephen Lowry from the University of Kent in the United Kingdom. “We can see that Itokawa has a highly varied structure—this finding is a significant step forward in our understanding of rocky bodies in the Solar System.”
Heading farther from the Sun, we encounter Jupiter and its many moons. Just in time for Galileo’s birthday, NASA announced the release of a detailed geological map of Ganymede, Jupiter’s giant moon that Galileo discovered more than 400 years ago. Based on data sent back by Voyagers 1 and 2 as well as the Galileo Orbiter (not the astronomer, but a mission named for him), the map helps disentangle Ganymede’s complex terrain—dark, old, cratered areas contrasting with lighter, not-quite-so-old regions criss-crossed by grooves and ridges. In the words of Robert Pappalardo of NASA’s Jet Propulsion Laboratory, “This map illustrates the incredible variety of geological features on Ganymede and helps to make order from the apparent chaos of its complex surface.” You can look for the full-resolution map available from the United States Geological Survey (USGS), including what seems to be a great wall-map!
“The surface of Ganymede is more than half as large as all the land area on Earth, so there is a wide diversity of locations to choose from,” said Geoffrey Collins of Wheaton College, who led the group of scientist-mapmakers. “Ganymede also shows features that are ancient alongside much more recently formed features, adding historical diversity in addition to geographic diversity.” Planetary geologists identified three major periods in Ganymede’s history, dominated first by impact cratering, then tectonics, followed by quiescence. All this work can help inform the mission of the European Space Agency’s Jupiter Icy Moons Explorer (JUICE) mission, slated to visit Ganymede around 2032.
Gazing outside our solar system, the European Space Agency’s Gaia mission created its first images from a vantage point nearly 100 million miles (more accurately, about 150 million kilometers) from Earth. Over time, Gaia will map the stars of the Milky Way more accurately than any of its predecessors: its goal of measuring the locations and positions of about one billion stars far exceeds the approximately 100,000 stars cataloged by the Hipparchos mission ’way back in the 1990s. Aside from giving us a dynamic map of our nearest billion neighbors, Gaia’s data will also help us understand the origin and evolution of our home galaxy.
Gaia will only observe stars as points of light; indeed, all but a few stars defy the resolving powers of our most powerful telescopes, so we see basically all stars as lonely points of light. But we can disentangle a star’s light to tell us quite a bit about its behavior—and even its appearance.
A group of astronomers recently announced that they had used such techniques to create a “weather map” of a brown dwarf. (Full disclosure: brown dwarfs technically don’t qualify as stars, but astronomers can still use the techniques I hinted at in the previous paragraph to interpret light from a point source to reveal details about its structure and appearance.) Ian Crossfield, at the Max Planck Institute for Astronomy, described his work: “Previous observations suggested that brown dwarfs might have mottled surfaces, but now we can actually map them. Soon, we will be able to watch cloud patterns form, evolve, and dissipate on this brown dwarf—eventually, exometeorologists may be able to predict whether a visitor to Luhman 16B could expect clear or cloudy skies.” Because the brown dwarf’s surface temperature hovers near 2,000°F (around 1,000°C), such “cloudy skies” could portend molten iron rain, but hey, who’s ever happy with the weather forecast?
By the way, you can even make your own origami balloon version of Luhman 16B (although I’d recommend finding better folding directions than those that appear on the PDF)!
With stars come planets, and a new NASA-sponsored site asks citizen scientists to help “find the birthplace of planets” in images from the Wide-Field Infrared Survey Explorer (WISE) mission’s map of the entire sky. Planets form in dusty disks that shine in infrared light, but galaxies, interstellar gas, and asteroids also glow in the infrared, so it takes a clever searcher to spot the nascent planetary systems. According to said James Garvin, from NASA’s Goddard Space Flight Center, “Through Disk Detective, volunteers will help the astronomical community discover new planetary nurseries that will become future targets for NASA's Hubble Space Telescope and its successor, the James Webb Space Telescope.” Head over to diskdetective.org to lend a hand!
In addition to raising families of planets, stars live out lifetimes that depend on the mass of the original object. The most massive stars end quite dramatically, in events called supernovae, which leave behind intricate and energetic nebulae, including the famous Cassiopeia A. Now, recent observations of this leftover from a violent cosmic explosion have revealed the complexity of such phenomena. “Stars are spherical balls of gas, and so you might think that when they end their lives and explode, that explosion would look like a uniform ball expanding out with great power,” said Fiona Harrison of the California Institute of Technology. “Our new results show how the explosion's heart, or engine, is distorted, possibly because the inner regions literally slosh around before detonating.”
All the objects I’ve discussed so far—from the asteroids in our solar system to Luhman 16B and Cassiopeia A—reside within our own Milky Way galaxy. But many other galaxies exist outside our own, and astronomers study these very distant objects to glean an understanding of grand processes taking place far from home.
I mentioned that stars (and their attendant planets) form from clouds of gas and dust, and it turns out that galaxies also take shape and evolve over time. Unlike stars and planetary systems, however, galaxies undergo collisions and mergers and bursts of star formation over the course of billions of years. In between such major events, some spiral galaxies maintain an impressive, steady pace of star formation, but how? Of course, you can’t make something from nothing…
“We knew that the fuel for star formation had to come from somewhere. So far, however, we’ve detected only about 10 percent of what would be necessary to explain what we observe in many galaxies,” said D.J. Pisano from West Virginia University. “A leading theory is that rivers of hydrogen—known as cold flows—may be ferrying hydrogen through intergalactic space, clandestinely fueling star formation. But this tenuous hydrogen has been simply too diffuse to detect, until now.”
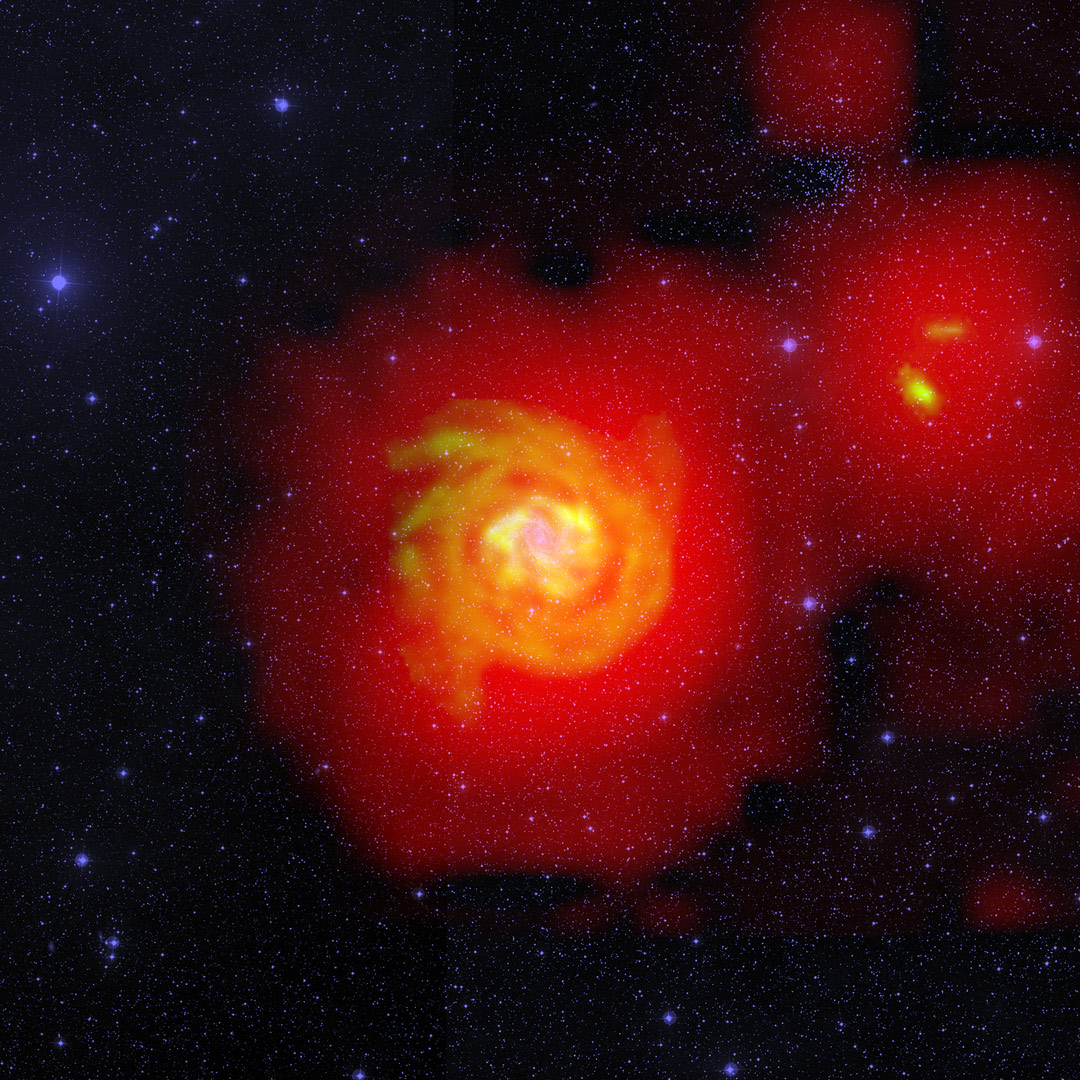
Pisano looked at the nearby (meaning a mere 22 million light years away) spiral galaxy NGC 6946, in search of such “cold flows” of hydrogen gas that has never been warmed by the heat of star formation or supernova explosions. He used the National Science Foundation’s Robert C. Byrd Green Bank Telescope to make extremely sensitive measurements of radio emissions from around the galaxy—and no, these aren’t radio transmissions from little green men but rather faint, natural emissions the likes of which we would expect from such cold gas. His observations revealed a faint glow of hydrogen that connected NGC 6946 to its neighboring galaxies (see the image above, in which the cold flows appear color-coded red). Expected, but unseen until now.
As we look at objects farther away from home, we also have to recognize that we’re actually seeing back in time… We see galaxies that lie billions of light years from home, when the Universe was much younger, and we can even see all the way back to the Comic Microwave Background (CMB), a veritable “baby picture” of the Universe at an age of only 380,000 years (more on that in a moment). Although astronomers are working to fill in blank spots that cannot be observed with our current ground- and space-based observatories, they are also using theory and computer models to predict what to look for!
Overall, the Universe has gone from hot and dense in its earliest stages to cool and diffuse today. But there are sources of heat, too—I previously mentioned star formation and supernovae, but early on, black holes probably played a critical role in warming things up! Now researchers have suggested that the black holes’ contribution occurred later than once thought. “It was previously believed that the heating occurred very early,” says Rennan Barkana of Tel Aviv University, “but we discovered that this standard picture delicately depends on the precise energy with which the X-rays come out. Taking into account up-to-date observations of nearby black-hole binaries changes the expectations for the history of cosmic heating. It results in a new prediction of an early time (when the universe was only 400 million years old) at which the sky was uniformly filled with radio waves emitted by the hydrogen gas.”
A good theory allows for specific observations that can bolster it—or prove it wrong. In this case, the signature of black hole heating should be written in the hydrogen gas, measurable in radio wavelengths. And since the theorists propose that the cosmic heating occurred later than previously thought, observers will not have to search as far back in time, which makes their job easier.
Ending on an even more mind-bending note… Remember the CMB I mentioned before? The aforementioned baby picture? It tells us a lot about the Universe, but some details reveal inconsistencies with what we see close to home—the distribution of galaxies, for example. Adam Moss, from the University of Nottingham, explains: “We observe fewer galaxy clusters than we would expect from the Planck results and there is a weaker signal from gravitational lensing of galaxies than the CMB would suggest. A possible way of resolving this discrepancy is for neutrinos to have mass. The effect of these massive neutrinos would be to suppress the growth of dense structures that lead to the formation of clusters of galaxies.” Neutrinos (nicknamed “ghost particles”) interact very weakly with ordinary matter (such as you or me), and scientists have only recently confirmed that these wee ghosts have mass. How much mass is up for debate.
Moss and his colleague Richard Battye from the University of Manchester have estimated that neutrinos on average are more than five times as massive as the lower limit established by particle physics—and slightly greater than the upper bound previously established using cosmological measurements. Battye noted, “If this result is borne out by further analysis, it not only adds significantly to our understanding of the sub-atomic world studied by particle physicists, but it would also be an important extension to the standard model of cosmology which has been developed over the last decade.”
Physics Today and Scientific American both offer enlightening (and much more in-depth) perspectives on the topic.
For more such big-picture questions, check out our current planetarium show, Dark Universe, which premieres at a very special cosmology-themed NightLife this Thursday, February 27th. Or come to NightLife on Thursday, March 20th, and check out “Universe Update” live in the Morrison Planetarium.
Ryan Wyatt is the director of Morrison Planetarium and Science Visualization at the California Academy of Sciences.
Image: D.J. Pisano (WVU); B. Saxton (NRAO/AUI/NSF); Palomar Observatory – Space Telescope Science Institute 2nd Digital Sky Survey (Caltech); Westerbork Synthesis Radio Telescope