These immersive infographics, data visualizations, and videos make great interactive learning resources for secondary students or science teachers. All come straight from bioGraphic, a multimedia magazine powered by the Academy.
Videos
Lens of Time: Spider Seduction

For these jumping spiders, stayin' alive requires all the right dance moves—and the perfect soundtrack, too.
Lens of Time: How Hummingbirds Hover
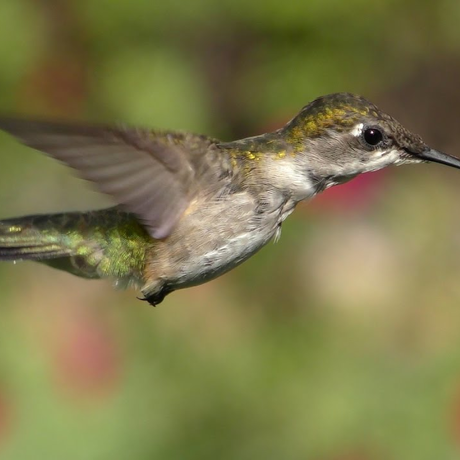
Scientists are beginning to unlock the secrets of one of nature’s most acrobatic flyers.
Lens of Time: Corals in Motion
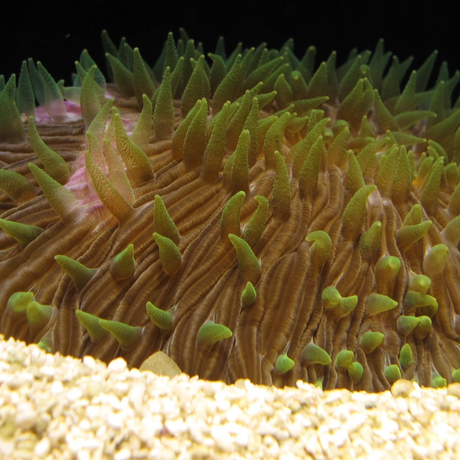
Corals occupy their own time dimension, but if given enough time, they reveal a surprising array of behaviors.
Lens of Time: Slime Lapse
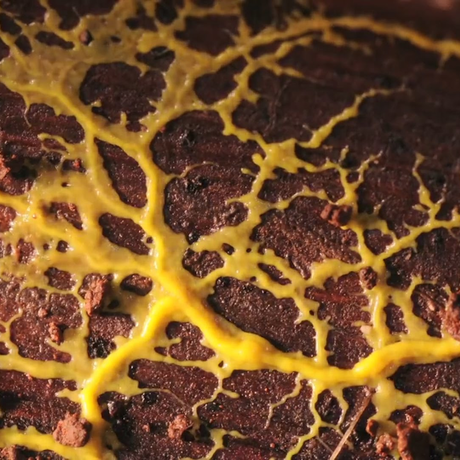
What these single-celled blobs lack in brain power, they make up for with surprisingly complex decision-making.
Lens of Time: Bumper Bees
See how scientists use high-speed videography to investigate—and learn from—the clumsy flight of the bumblebee.
Lens of Time: Velvet Worms—Secret of the Slime

Physics and biology meet to create one of the world's strangest weapons: the slime cannon.
Invisible Nature: The Glowing Squid

The Hawaiian bobtail squid can cruise above its prey without casting a shadow—even on a moonlight night—thanks to its relationship with a bacterial partner.
Invisible Nature: Code of the Treehopper
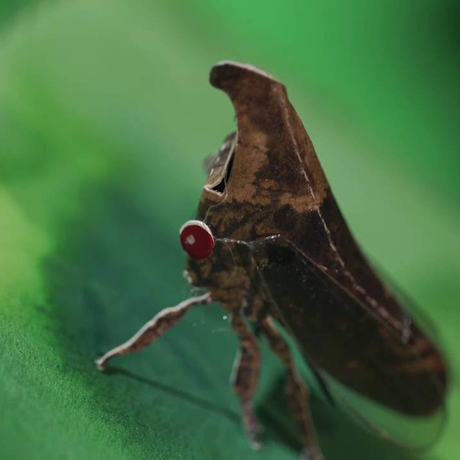
Hiding in plain sight and deceptively still, treehoppers have evolved an ingenious way to communicate.
Invisible Nature: Return of the Wood Frog
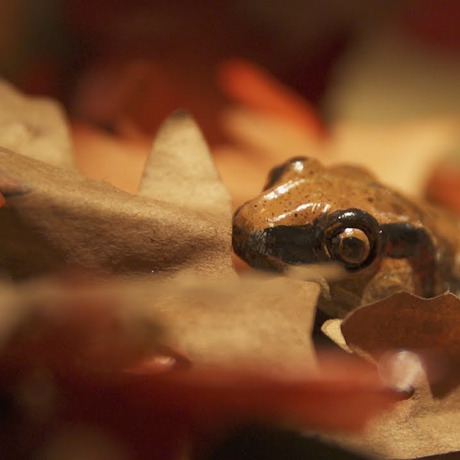
A common frog species takes an unusual approach to winter—one that would kill most other vertebrates.
Lens of Time: Bat Ballet
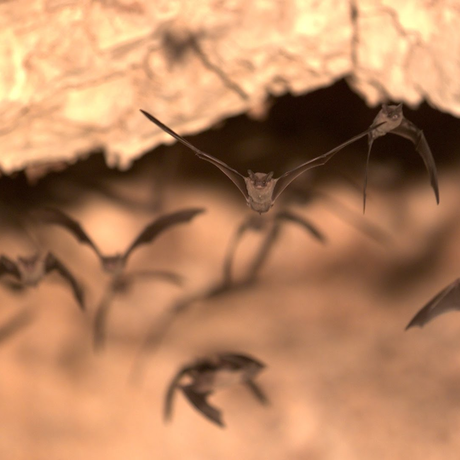
How do hundreds of thousands of bats emerge from a hole in the ground without traffic jams or (many) casualties?
Interactive Infographics
From Leaf to Landscape
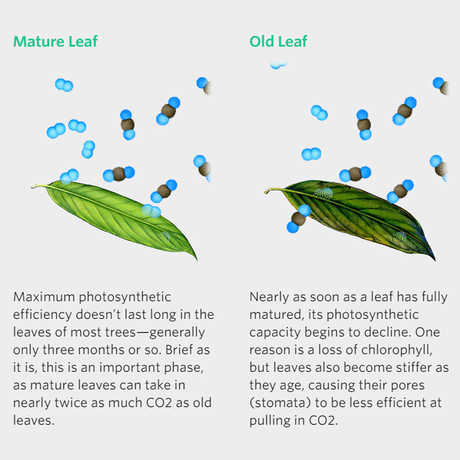
A rainforest’s ability to take a deep breath depends on a somewhat surprising factor—the age of its leaves.
The Color of Drought

In this silent video, view color-coded data which show how California's trees were affected by drought in 2016.
Catching the Rainforest's Breath
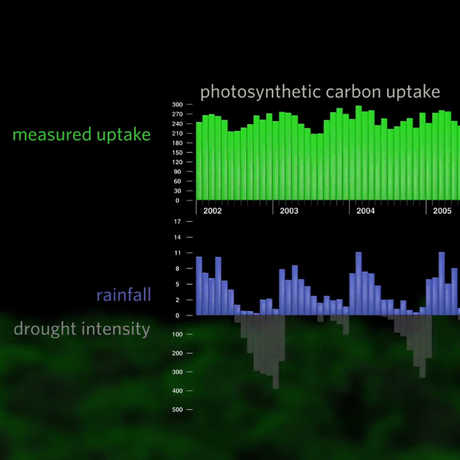
Ecosystem-wide, is the Amazon storing or releasing more carbon dioxide? Watch this silent clip to view the data.