Science Mapping
Students can map concepts in the notebook to make their understanding visible. Use these mapping techniques for pre-assessment to see what students know, or as a post-assessment at the end of a unit.
About This Guide
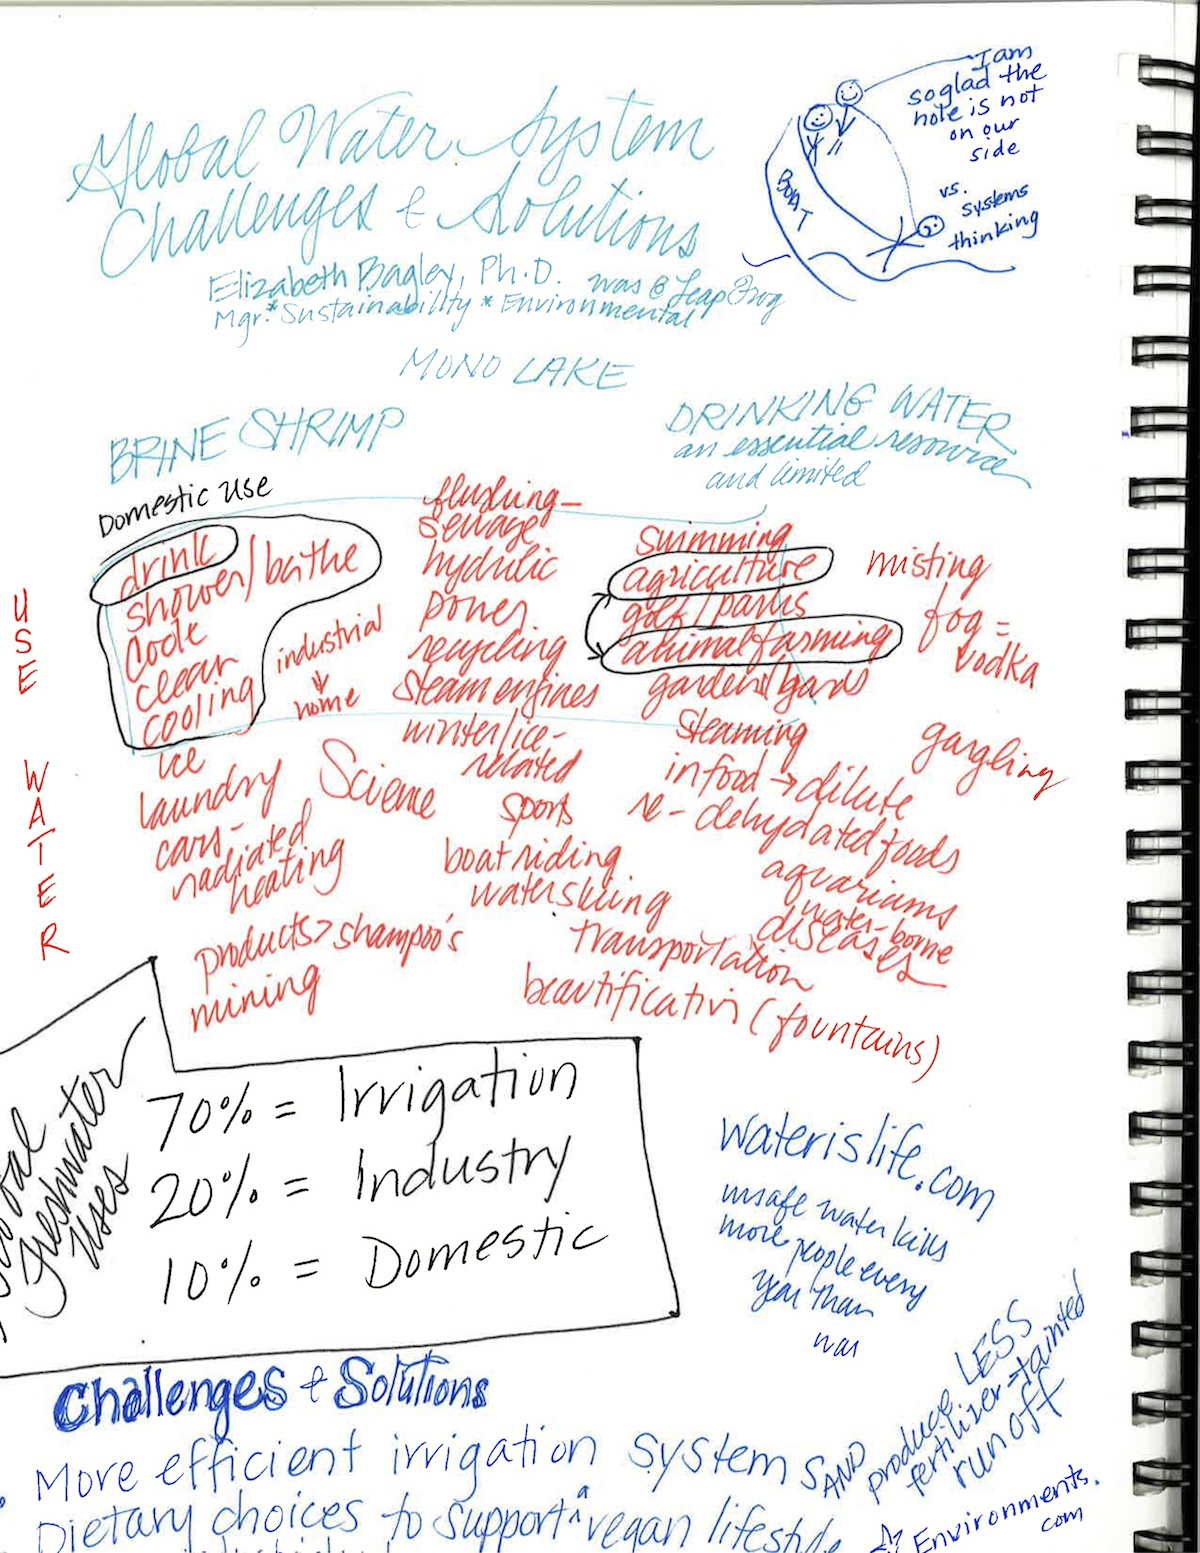
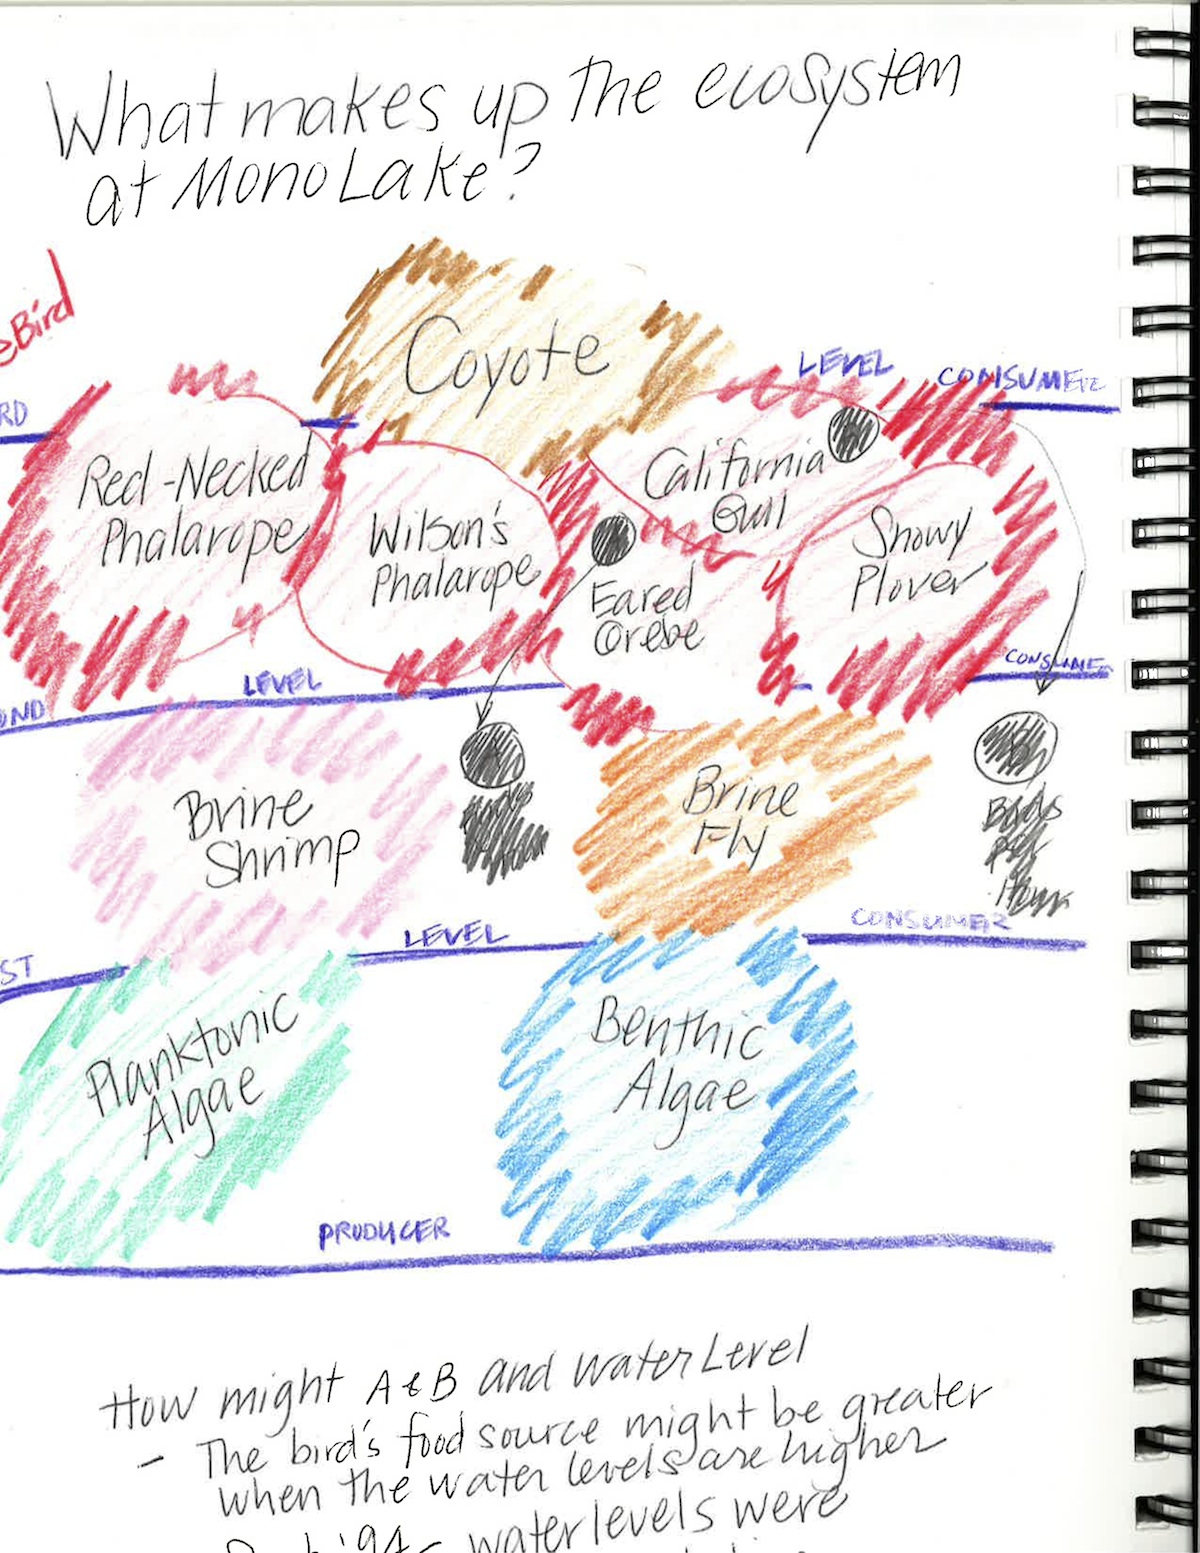
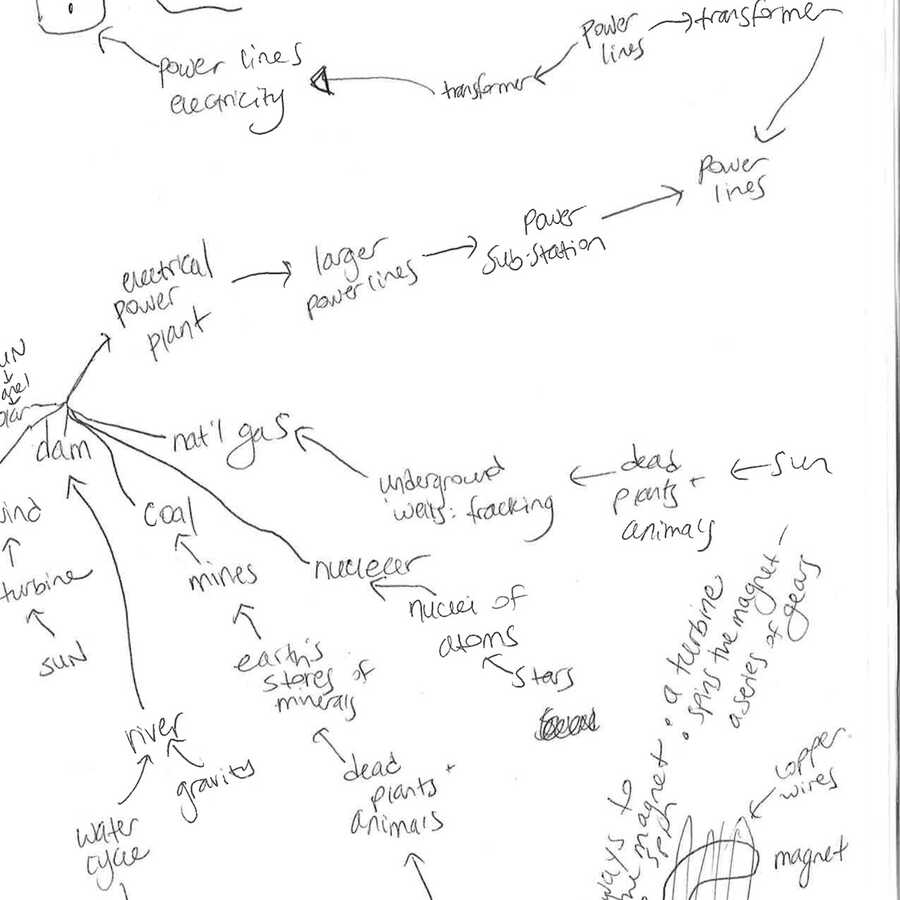
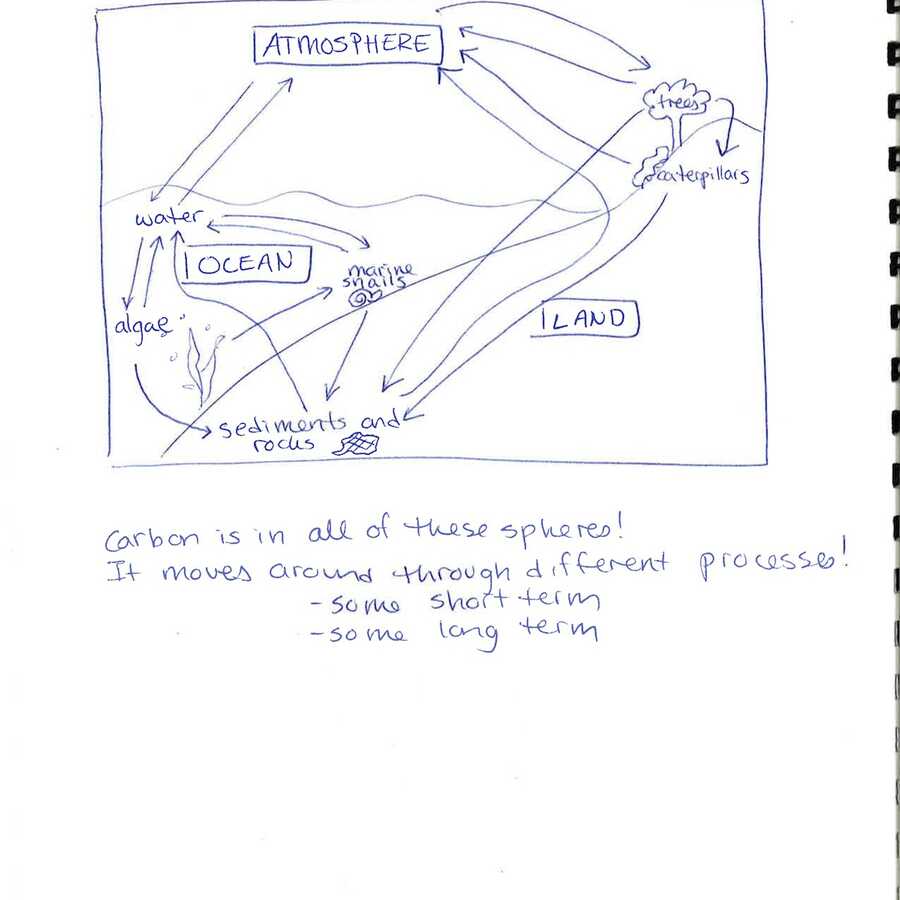
Mapping can help make an abstract concept come to life, like the rock cycle or a complex food web. Mapping can also help students name parts of a system and their interactions, like the different parts of the human digestive system or how electricity gets from the power plant to the outlet in a home. Making these processes visual can help students surface their ideas and make meaning out of phenomena that are difficult to observe.
Below, you’ll find guidance on a few ways mapping can help your students understand scientific concepts, including:
- Story Mapping
- Diagramming
- An example from a real classroom
Because we know teachers appreciate seeing the results of using these strategies, we've also created an example gallery containing student work.
Story Mapping
When students make a story map, they are illustrating where something came from or where it will go. For instance, where did my tap water come from? Or, where was the electricity before it got to the outlet? Or, what happens to food after I eat it? Students start with one point in the story, such as "water comes out of my tap," and trace either backwards or forwards to describe each step of the process. For instance, "before my tap, there is a pipe; before the pipe there is a holding tank, etc." Students create story maps with pictures, arrows, descriptions and explanations. Story mapping can be done as a pre-assignment, just to see what students already know. It can also be done in the middle of a unit, after you have introduced some content, or it can be done as an assessment at the end of a unit to see what students have learned.
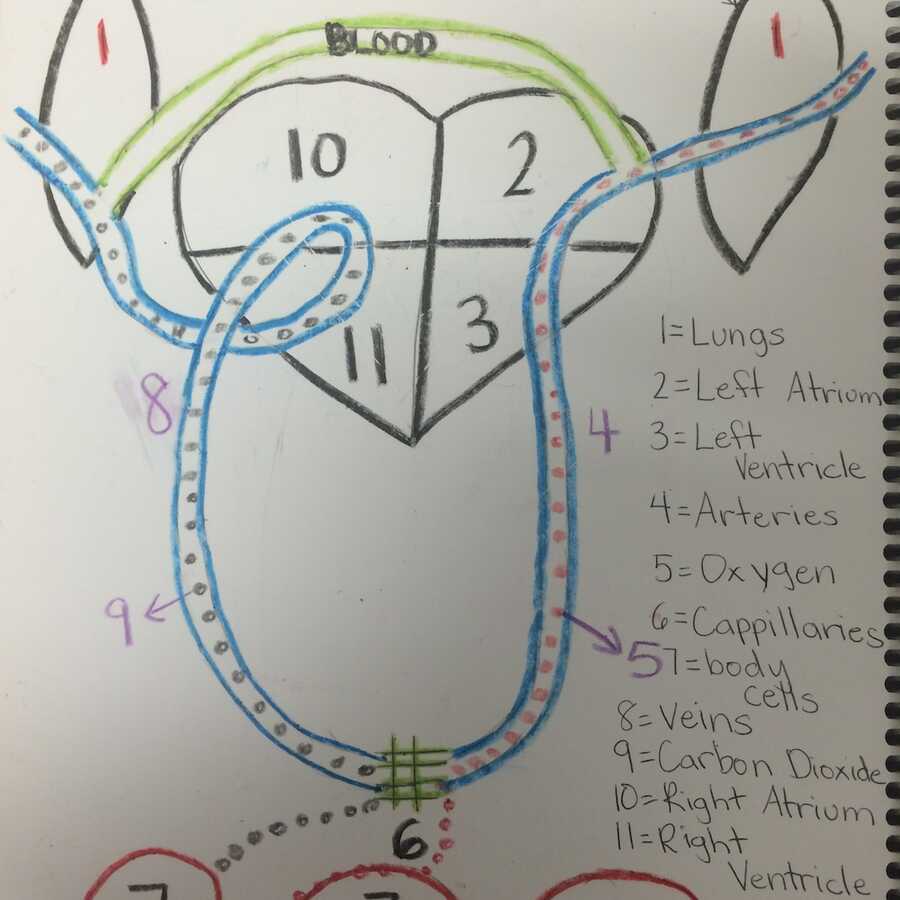
Diagramming
This strategy is helpful for capturing phenomena that happen over time. Students can diagram a lengthy process by creating snapshots of different moments in time. For instance, they could depict the rock cycle or the orbits of the planets. Or, they can diagram a rapid process by creating freeze-frames that break it down. For example, they could draw freeze-frames that show how the blade of a windmill turns.
See more examples in our Gallery
How To Make It Happen
- Give ample time for student mapping. Students can get really invested in their maps!
- Encourage students to use arrows, labels, and images in their mapping. The goal is to make student thinking visible.
- An actual source map or diagram to refer to at some point can be helpful to anchor student understanding. You can make one yourself or use an existing resource that the whole class can reference.
- Think about how you want to use the map; as a pre-assessment, to see what students already understand? Or as a post assessment, to see what students have learned? The science content students have been exposed to will change how detailed and accurate their maps are.
Notes from the Classroom
Rob was having trouble making the human body systems unit come alive for his 5th grade students. He had tried using images in the science textbook, and having his students make a giant human class model of the circulatory system, but nothing seemed to stick.
One day when he was tending to his class pets, Rob realized he could use these Madagascar hissing cockroaches and Norway rats as models of the digestive system. Since his students rotated through roles of feeding and cleaning up after the pets, they were already familiar with the inputs and outputs of digestion.
Rob decided to have his students map what they thought was happening inside each of his class pets. He asked, How does their food turn into waste? Rob also asked students to compare and contrast the cockroach’s and rat’s digestive systems. He then had his students try to create a map of the human digestive system. Finally, they compared their maps with the images in the textbook. The whole process really helped his students understand digestion.