To learn about and investigate seasonal changes in plants through participation in a citizen science project to help scientists understand how climate change is affecting the timing of phenological events.
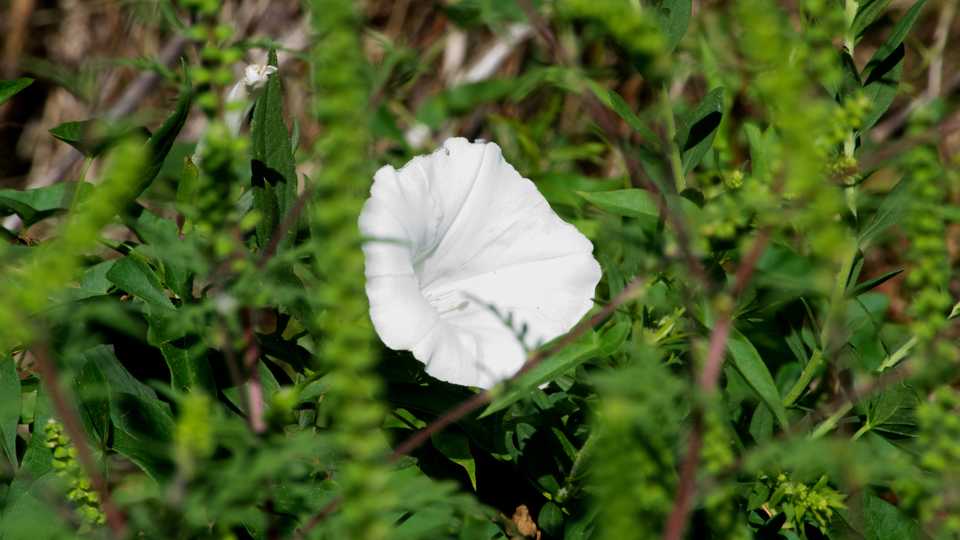
©ohkylel
0
Is there a plant near your house or school that produces beautiful flowers in the spring, or a tree whose leaves change to striking colors in the fall? Do you think those flowers blooming or color change happens on the same day every year? By becoming a citizen scientist through Project BudBurst, you’ll investigate questions just like those and will help scientists answer big questions about plants, seasons, and climate change!
Activities Content Standards
What's the Question? NGSS: Science Practices
Plant Scavenger Hunt NGSS: Crosscutting Concepts
Create a Field Guide Common Core: English Language Arts
Pick Your Sites and Plants Common Core: Mathematics
Become a BudBurst Citizen Scientist
Objective
Materials
-
Paper
-
Pens/pencils
-
Digital cameras/smart phones
-
Computer access
-
GPS/smart phone
- Project BudBurst data sheets
Teacher Prep
All investigations take preparation. Before your students get started, take a moment to become familiar with the Project BudBurst.
- Read through the background information about plant groups and phenophases.
- Create your own account.
- Project BudBurst requires students under the age of 13 to have a parent, guardian or teacher register for them. Educator accounts on Project BudBurst allow formal and informal educators to register classroom sites and create student reporter accounts.
- Scroll through any data that already exist from that area. Which species have you seen before? Which are unfamiliar to you? Who collected those data?
- Decide what type of data will be most practical for your students to collect: Regular Reports or Single Reports.
Activity 1: What's the Question?
Have your students explore the Project BudBurst website. (Project BudBurst was started by botanists and ecologists who are interested in the effects of climate change.)
Ask your students to answer the fallowing questions after exploring the website:
Activity 2: Plant Scavenger Hunt
Where are plants growing in your schoolyard or near your school?
- Have your students go on a walk and look for areas that are vegetated.
- When they find a spot, do some careful observation and see if there is more than one kind of plant (e.g., trees, bushes, and flowers/grasses).
- Allow your students to practice taking photos of plants.
- You can refer to the Project BudBurst Botanical Scavenger Hunt activity to learn how to take photos of plants that will help people identify them.
Activity 3: Create a Field Guide
- Have your students pick a 5-6 spots that they found during the Scavenger Hunt that seemed like they had a good number of plants.
- Break them into groups, and each group creates a field guide to the plants that are in one spot.
- You can use the Project BudBurst Mystery Plant Identification activity, the Using a Key to Classify Plants activity, or the Field Guide to the Biodiversity of your Schoolyard activity as references and guides.
- If your students need help identifying some of the plants, you can use existing field guides or you can take some good photos and post them on iNaturalist to see if someone can assist you with the ID, or you could try out the LeafSnap app to help with identification of trees.
Activity 4: Pick your Sites and Plants
- Have your students compare their field guides to the lists at BudBurst’s Plants to Observe; you can look at their top 10 list or the lists by state.
- Which of the spots your students made field guides for have the most plants on the BudBurst list for your state, or have some plants from the top 10 list?
- Discuss the pros and cons of each site.
- Decide how many field sites you want:
- One on either side of your school that you can compare?
- A shady site, a sunny site, and one in-between site?
- After you’ve chosen your sites, each group of students should then pick one plant they’re going to monitor at each site.
Activity 6: Become a BudBurst Citizen Scientist
Time to collect some data about your chosen plants!
- Make sure you have the correct report forms downloaded and printed, and you have all the needed equipment and know all the steps you need to follow.
- Have your students add the data they collected about their site to the form, and then once they are observing their plant, add the data about the plant’s phenology.
- Once your students' data sheet is totally complete (either after one day’s observations if you’re doing a Single Report or after many observations if you’re doing a Regular Report), be sure either you or your students upload their data so scientists can use it!
- You will upload your reports under your or your students' BudBurst account.
Activity 7: Explain Your Data
After collecting data, how do scientist know if they’ve answered their question? They need to examine and analyze their data to determine the results.
- A day or so after uploading your students data, have yours students check the Data Map at Project BudBurst.
- Can they find their observations?
- Are there lots of observations or just a few from their state this year?
- How is their data important if there are many observations from your state?
- How are they important if there are few observations from your state?
- Then look at all the data collected by your class. What questions do you think you can answer by looking at your class data?
- Pick a question and examine the data to see if you can answer it. Possible questions include:
- Is there a difference in phenological timing among different species of plants?
- Is there a difference in phenological timing of the same species located in different places?
- The easiest way to examine the data may be to make a graph so you can visualize them, or to put the data in a logical order that will help you see trends.
- Allow your students to think about the questions scientists are trying to answer through Project BudBurst.
- Do you think just the data from your class could answer that question? Why or why not?
- Project BudBurst allows you to see in various ways and download all the data uploaded to their project. With your class, decide on some Project BudBurst ways to examine your data. See if they can detect phenological differences between or among years.
- Depending on your timeframe and student skill level, you could just work with your class’ data. Looking at Project BudBurst data could be an extension activity for higher-level (high school) classes or interested students.
Activity 8: Construct a Scientific Argument
Use the Claim-Evidence-Reasoning model to construct a scientific argument for one of the questions you examined the data to answer.
- A claim is a statement or conclusion that answers the original question/problem.
- Evidence is the scientific data that supports your claim.
- Reasoning is a justification that connects the evidence to the claim. It shows why the data you offer counts as evidence by addressing appropriate scientific principles.
Extend Your Experience
Spread the Word
Ask your students:
- What is the most interesting or important thing you discovered from the data you collected and/or analyzed?
- Who in your community should know about it?
If your students are interested in sharing their findings, follow the steps in Modern Media Blitz to share their stories to create a social media campaign to share their results.
Next Generation Science Standards
NGSS Science Practices
-
Asking questions
-
Planning and carrying out investigations
-
Analyzing and interpreting data
-
Using mathematics and computational thinking
-
Constructing explanations
-
Engaging in argument from evidence
Participation in Project BudBurst, as framed in this project, will guide your students through the full scientific inquiry process. As they figure out the questions being asked, they will determine how the methods and their data collection aid in answer those questions. They’ll examine their data to look for trends and then support their claims through evidence. Finally, they’ll communicate their results to a wider audience.
NGSS Crosscutting Concepts
-
Patterns.Observed patterns of forms and events guide organization and classification, and they prompt questions about relationships and the factors that influence them.
-
Scale, proportion, and quantity. In considering phenomena, it is critical to recognize what is relevant at different measures of size, time, and energy and to recognize how changes in scale, proportion, or quantity affect a system’s structure or performance.
-
Stability and change. For natural and built systems alike, conditions of stability and determinants of rates of change or evolution of a system are critical elements of study.
Students will think critically about how change at different scales affects plants, both in the short-term (seasons), and in the long-term (climate change). They’ll also examine their data in the context of a large, national community of citizen scientists and should understand why scientists need these type of data in quantity and over a long period of time to accurately answer their questions.
Common Core Standards
Common Core: English Language Arts Anchor Standards
-
CCSS.ELA-Literacy.CCRA.R.1 Read closely to determine what the text says explicitly and to make logical inferences from it; cite specific textual evidence when writing or speaking to support conclusions drawn from the text.
-
CCSS.ELA-Literacy.CCRA.R.2 Determine central ideas or themes of a text and analyze their development; summarize the key supporting details and ideas.
Students will peruse the Project BudBurst website to determine the questions being answered through the project. To do so, they will need to think critically about the information being presented and make inferences about the overall focus of Project BudBurst, the research interests of the scientists involved, and what types of questions can be answered through the data being provided by the citizen scientists.
-
CCSS.ELA-Literacy.CCRA.R.7 Integrate and evaluate content presented in diverse media and formats, including visually and quantitatively, as well as in words.
Students will need to take information presented textually via the Project BudBurst website and trends and patterns found in the data they’ve collected to make logical conclusions.
-
CCSS.ELA-Literacy.CCRA.W.1 Write arguments to support claims in an analysis of substantive topics or texts using valid reasoning and relevant and sufficient evidence.
- CCSS.ELA-Literacy.CCRA.W.4 Produce clear and coherent writing in which the development, organization, and style are appropriate to task, purpose, and audience.
-
CCSS.ELA-Literacy.CCRA.SL.4 Present information, findings, and supporting evidence such that listeners can follow the line of reasoning and the organization, development, and style are appropriate to task, purpose, and audience.
As part of forming logical arguments based on Project BudBurst data, students will need to be able to support their claims based on evidence. To communicate their conclusions to a wider audience, they will need to present information and results coherently and in a manner that builds logically to their conclusions.
-
CCSS.ELA-Literacy.CCRA.W.6 Use technology, including the Internet, to produce and publish writing and to interact and collaborate with others.
-
CCSS.ELA-Literacy.CCRA.SL.5 Make strategic use of digital media and visual displays of data to express information and enhance understanding of presentations.
Depending on how students end up communicating their conclusions, they may use the internet to produce a social media campaign, or they may design a poster or PowerPoint presentation to present their results. Regardless of format, creating visually compelling displays of their data will be important in clear communication.
-
CCSS.ELA-Literacy.CCRA.L.1 Demonstrate command of the conventions of standard English grammar and usage when writing or speaking.
-
CCSS.ELA-Literacy.CCRA.L.2 Demonstrate command of the conventions of standard English capitalization, punctuation, and spelling when writing.
Communication in many forms is a key part of this project. Students will have ample opportunity to work on their writing and speaking skills, and with constructive feedback from their instructor(s) and peers, will learn and improve.
Standards for Mathematical Practice
- CCSS.Math.Practice.MP1 Make sense of problems and persevere in solving them.
-
CCSS.Math.Practice.MP6 Attend to precision.
Through participating in Project BudBurst, students will need to determine how their data are answering the question(s) (problems) being posed by the scientists. While their data will likely not answer (solve) the question, students will understand how their data, combined with data collected by the larger community of citizen scientists, will be used by scientists to try to address the question(s). Because they are contributing to a real research project, data provided by students will need to be accurate, encouraging careful collection and precision.
- CCSS.Math.Practice.MP2 Reason abstractly and quantitatively.
- CCSS.Math.Practice.MP3 Construct viable arguments and critique the reasoning of others.
Students will use their own or other data from Project BudBurst to try to answer their questions. Examining data to understand how they could potentially answer a question will require critical thinking and both abstract and quantitative reasoning. Once they think they can answer their question, students will need to create logical arguments that support their conclusions.
- CCSS.Math.Practice.MP5 Use appropriate tools strategically.
To examining their Project BudBurst data to answer a question, students will need to determine what tools will best help them visualize results: spreadsheets, pie charts, bar graphs, etc.
Citizen Science Toolkit
Check out our Citizen Science Toolkit, designed to help educators integrate citizen science projects into classroom curricula or afterschool programming.
It contains resources—including lessons, readings, and worksheets—to help communicate the value of citizen science to students and cultivate their sense of empowerment and impact when performing science investigations.
Appropriate for: 6th Grade - 12th Grade
Standards for: 6th Grade
Prep Time: 30 minutes
Activity Time: 120 minutes
Subjects: Constructing Explanations, ELA Common Core